What is comparison chart?
Comparison chart shows the percentage change between two asset classes in the same time period. We know that past performance does not guarantee future results, however, there is a good chance that it will continue unless something significant changes. Here are the reasons we should look at comparison charts:
-
To pick the best performing security or asset class(sector)
We want to maximize our returns for the same amount of investment. If a security or an asset class has outperformed the overall market for the past 5 years (for example), unless the market is saturated or there are strong emerging competitors, or some other significant reasonn, such security or asset class will continue to perform well in future. Hence, when we see a buy signal from market gauge, this chart helps us to zero in on a particular security to invest in. -
Diversify investment
As the famous saying goes - don't put all your eggs in one basket. We need a way to diversify our investments and it should be logical, methodical, and repeatable over time. Comparison chart helps us to pick several top performing security in an asset class or across asset class. -
Sector Rotation
Some securities have seasonal variations, for eg, around the month of November-January when many commercial banks share dividends, their price goes up. This is found in historical data. Similarly, some other sector perform better in other months. Just knowing this simple information, investors can make investment in appropriate time and book profits. Comparison charts helps to identify the seasonal patterns of a security.
Let's look at an example below to understand this:
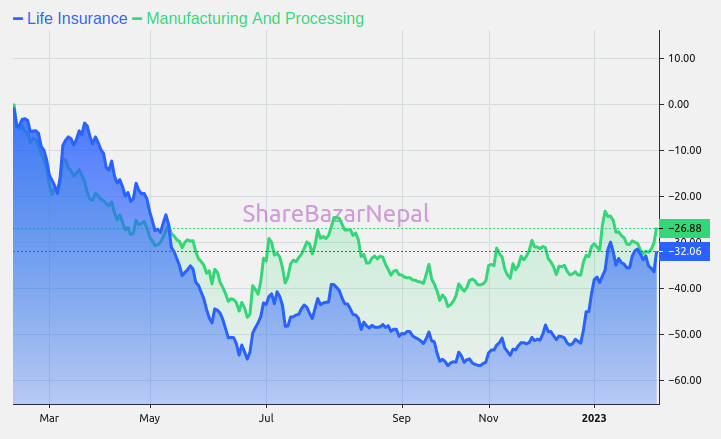
We can see from this comparison chart, in the bear market over the course of a year from February 2022 to February 2023, manufacturing and processing sector has consistently performed better. If you look at the chart from April 2022 to May of 2022 and compare the slope of life insurance sector with manufacturing sector, you can expect the manufacturing sector to outperform insurance sector in the coming future. As expected, manufacturing and processing sector has consistently out performed life insurance sector by around 10%.
Similarly, if you look at the upward slope from end of December 2022 to February 2023, you can see that the life insurance sector is increasing at a much higher rate than the manufacturing sector. This means that in the future if market remains bullish, it is wise to make changes in portfolio in favor of life insurance sector.